Is Your Sustainability Data Helping or Hurting You?
Examining sustainability data through the lens of 'the good, the bad, and the ugly', with real-life examples of different data management practices.


Sustainability has transitioned from a peripheral concern to a central pillar of modern business strategy. It starts with a commitment to long-term efforts that evolve over time, reflecting changing environmental and societal needs. And it involves integration into everyday practices, a continuous improvement mindset, and adaptation to new challenges along the way.
Organisations committed to achieving Net Zero (an internationally agreed upon goal for mitigating global warming before the second half of the century) are measuring greenhouse gas (GHG) emissions across their entire supply chains, building models, stress testing exposure, and preparing for future carbon prices and potential limits.
Innovative, forward-thinking companies are implementing robust data governance frameworks, setting internal carbon prices and assigning a cost to emissions, even if there is no carbon tax/levy in place. This gives teams a financial signal to prioritise low-carbon options in capital planning and procurement. It also helps filter out short-term wins that won’t stack up under future regulations or longer term timelines.
Procurement teams are starting to enforce carbon thresholds – if suppliers cannot or will not decarbonise, they are being phased out. Leadership teams are being held accountable for decarbonisation progress, and elements of annual renumeration/KPIs are starting to be tied to emissions targets, not just profits and sales.
Consultants are being hired to define clearer priorities. And teams at the coalface of energy and carbon data management are investing in fit-for-purpose sustainability management software to facilitate better and faster data-driven decisions.
Simply collecting and monitoring sustainability data is insufficient. Data should be analysed to extract meaningful insights that inform sustainability strategies and drive concrete actions. The key lies in identifying trends, understanding drivers, and implementing changes based on the findings.
Not All Data is Created Equal
The proliferation of data in the modern economy has been likened to the discovery of a new ‘oil’ due to its multiple uses, omnipresence, and varied benefits. However, just as raw crude oil requires refinement into its constituent parts to be useful, raw data needs careful management and scrutiny to yield actionable intelligence and insights.
Without robust sustainability data, organisations lack the ability to:
- Establish Baselines: Understanding the current state of their environmental and social impact is the first crucial step towards improvement. Data on energy consumption, GHG emissions, waste generation, water usage, and other relevant metrics provides this baseline.
- Set Meaningful Short-term and Long-term Targets: Once a baseline is established, organisations can set realistic and science-based targets for reducing their negative impacts, and enhancing their positive contributions.
- Track Progress: Consistent, reliable and timely data allows organisations to monitor their performance against established targets, identify areas of success, and areas needing improvement.
- Make Informed Decisions: Sustainability initiatives often involve significant investments and operational changes. Accurate data is vital for evaluating the potential impact and return on investment (RoI) of different sustainability solutions. As organisations consider sustainable and energy-efficient solutions, they must ensure these choices make sense in context and will deliver the intended results, both in the short term and long term.
- Manage Risks: Environmental and social risks, such as resource scarcity, regulatory changes, and reputational damage can have significant financial implications. Sustainability data helps organisations identify, assess, and mitigate these risks. Poor data quality can lead to inaccurate risk assessments and potentially harmful outcomes.
- Meet Reporting Requirements: The increasing prevalence of sustainability reporting mandates, such as the EU’s Corporate Sustainability Reporting Directive (CSRD), necessitates the collection and disclosure of comprehensive and verifiable sustainability data.
- Support Value Creation: Increasingly, consumers, investors, regulators, and other stakeholders are factoring sustainability performance into their decisions. Transparent and credible sustainability data can enhance brand reputation, attract investment, and foster customer/staff loyalty.
Factors contributing to these key challenges include:
- Data Quality Issues: Inaccuracies, overlaps, gaps, estimations, and reliance on poor proxies can severely undermine the reliability of sustainability data.
- Data Silos and Lack of Integration: Sustainability data is often scattered across various departments and systems (e.g. finance, energy management systems, waste management records, travel booking platforms), making it difficult to obtain a holistic view. Integrating these disparate data sources can be a significant challenge.
- Data Gaps and Inconsistent Collection: Incomplete or inconsistently collected data can hinder accurate analysis, reporting and actions. This can be due to manual data entry errors, lack of standardised collection protocols, reissued bills/invoices or difficulties in obtaining data from external stakeholders (e.g. Scope 3 emissions).
- Scope 3 Emissions Complexity: Measuring and reporting Scope 3 emissions is particularly challenging due to the vastness of the value chain (i.e. well to wheel), and the reliance on data from external entities over which the organisation has limited direct control. Different calculation methodologies and the availability of reliable emission factors add to this complexity, as well as the financial limitations for small or overseas businesses to collect and externally verify this data.
- Keeping Up with Evolving Regulations and Standards: The landscape of sustainability reporting is constantly evolving, with new regulations (mandatory) and reporting frameworks (voluntary) emerging, and existing ones being updated. Organisations need to stay informed and adapt their data collection and reporting processes accordingly.
- Lack of Expertise and Resources: Collecting, managing, and analysing sustainability data effectively requires specialised knowledge and resources, which may be lacking, particularly in smaller organisations or those located in developing countries.
- Timeliness of Data: Obtaining and processing data in a timely manner can be challenging, especially for high-frequency data streams, or data that requires manual collection and processing.
Types of Sustainability Data & Frequency of Collection
The spectrum of sustainability data is broad and encompasses various environmental and social parameters. Understanding the different types, units, and frequencies of sustainability data is fundamental for organisations seeking to build a robust and effective sustainability management system. It allows them to identify the data points that are most relevant to their operations and goals, and to establish appropriate cost effective collection and monitoring mechanisms.
Types of sustainability data include:
- Energy: Detailed information on electricity consumption, heating fuels (e.g. gas and oil), and transport fuels (e.g. petrol/gasoline and diesel/Jet A1).
- Direct GHG Emissions: Emissions that are directly generated by an organisation's activities, such as those from HVAC/cooling systems (F-gases), and other non-energy-related sources (e.g. methane).
- Waste: Information related to disposal and collection, such as the segregation and potential contamination of green waste, as well as final disposal.
- Water: This encompasses data on water supply (piped and on-site wells) and water treatment/disposal, tracking both consumption and discharge.
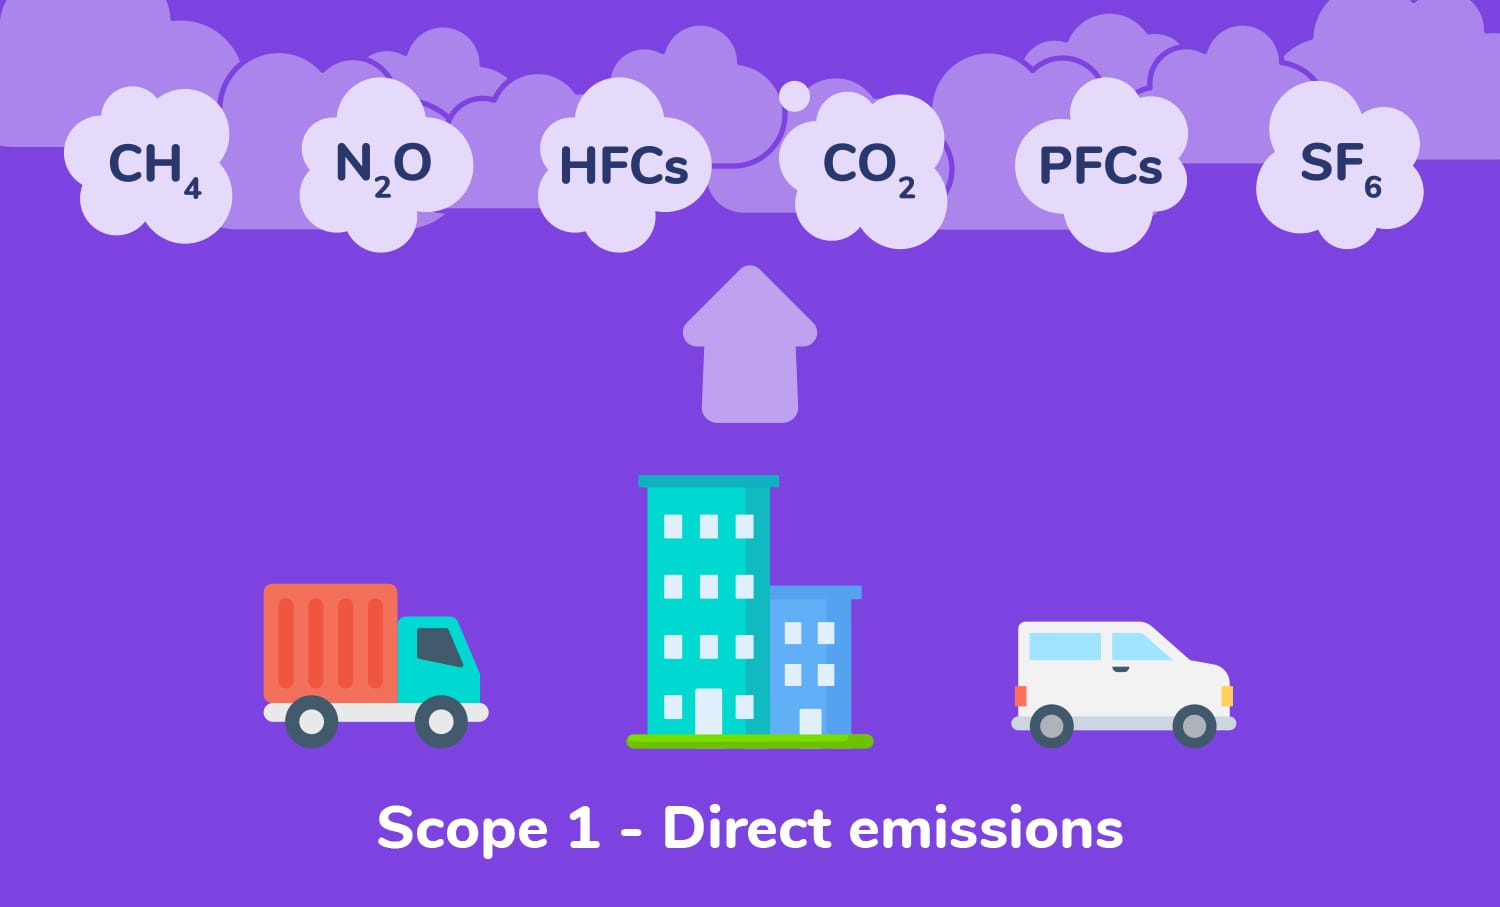
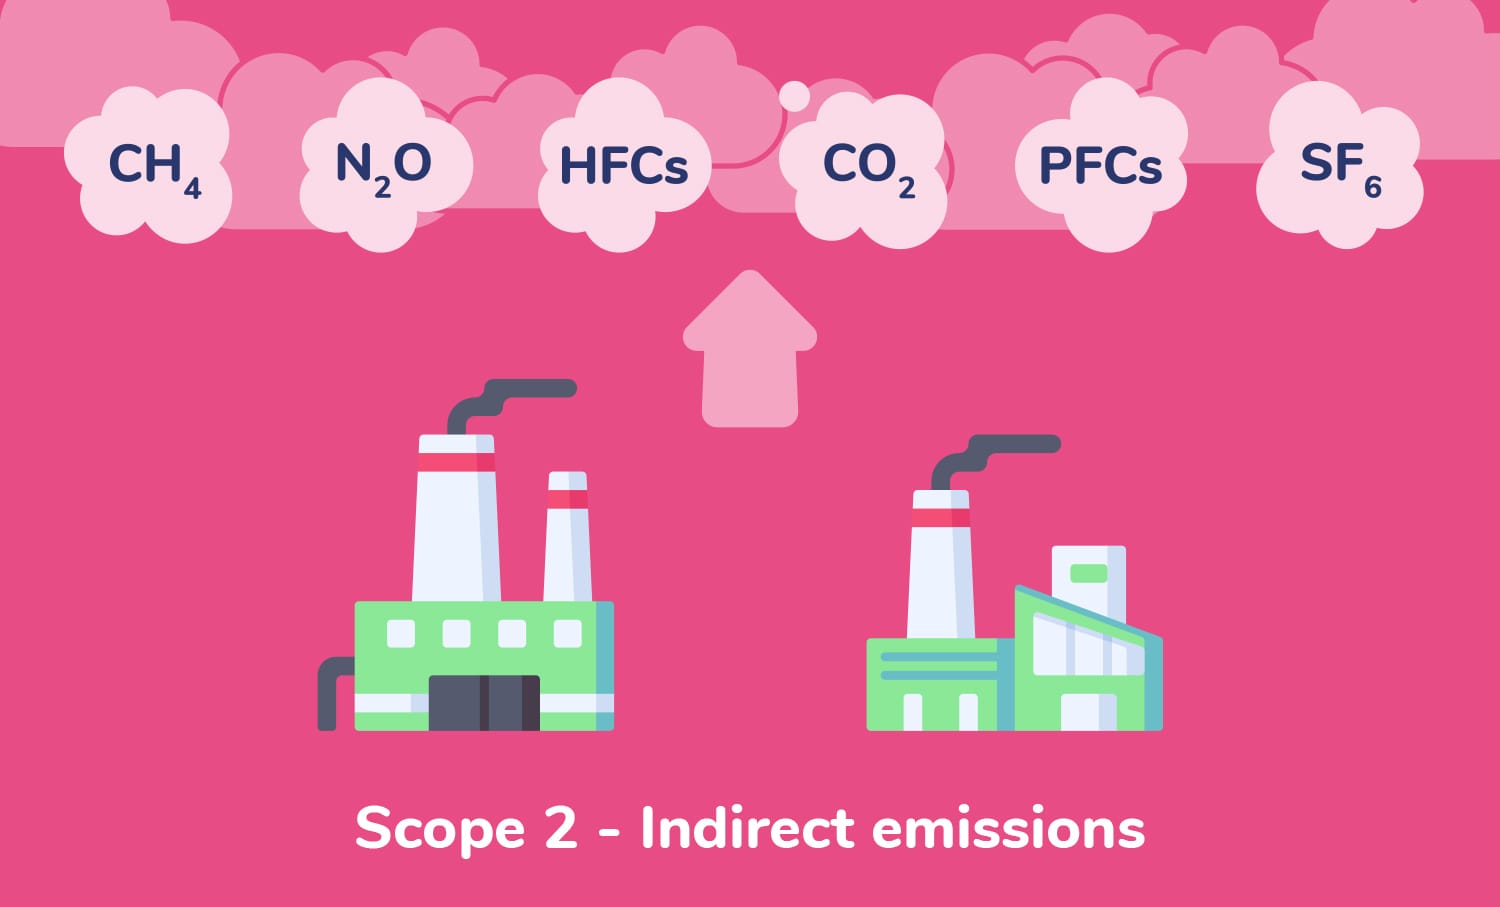
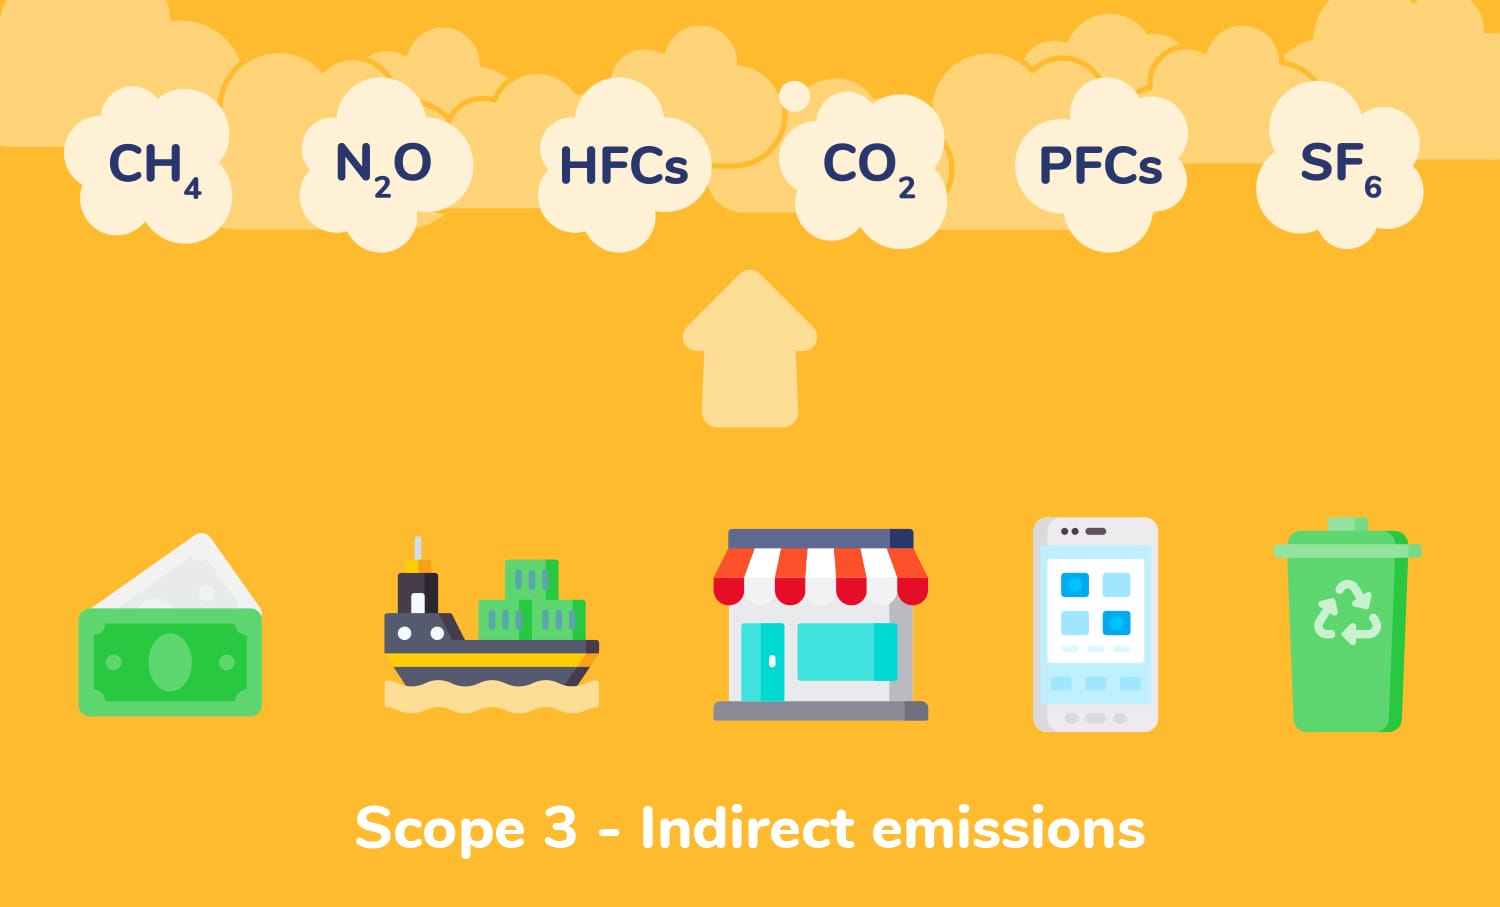
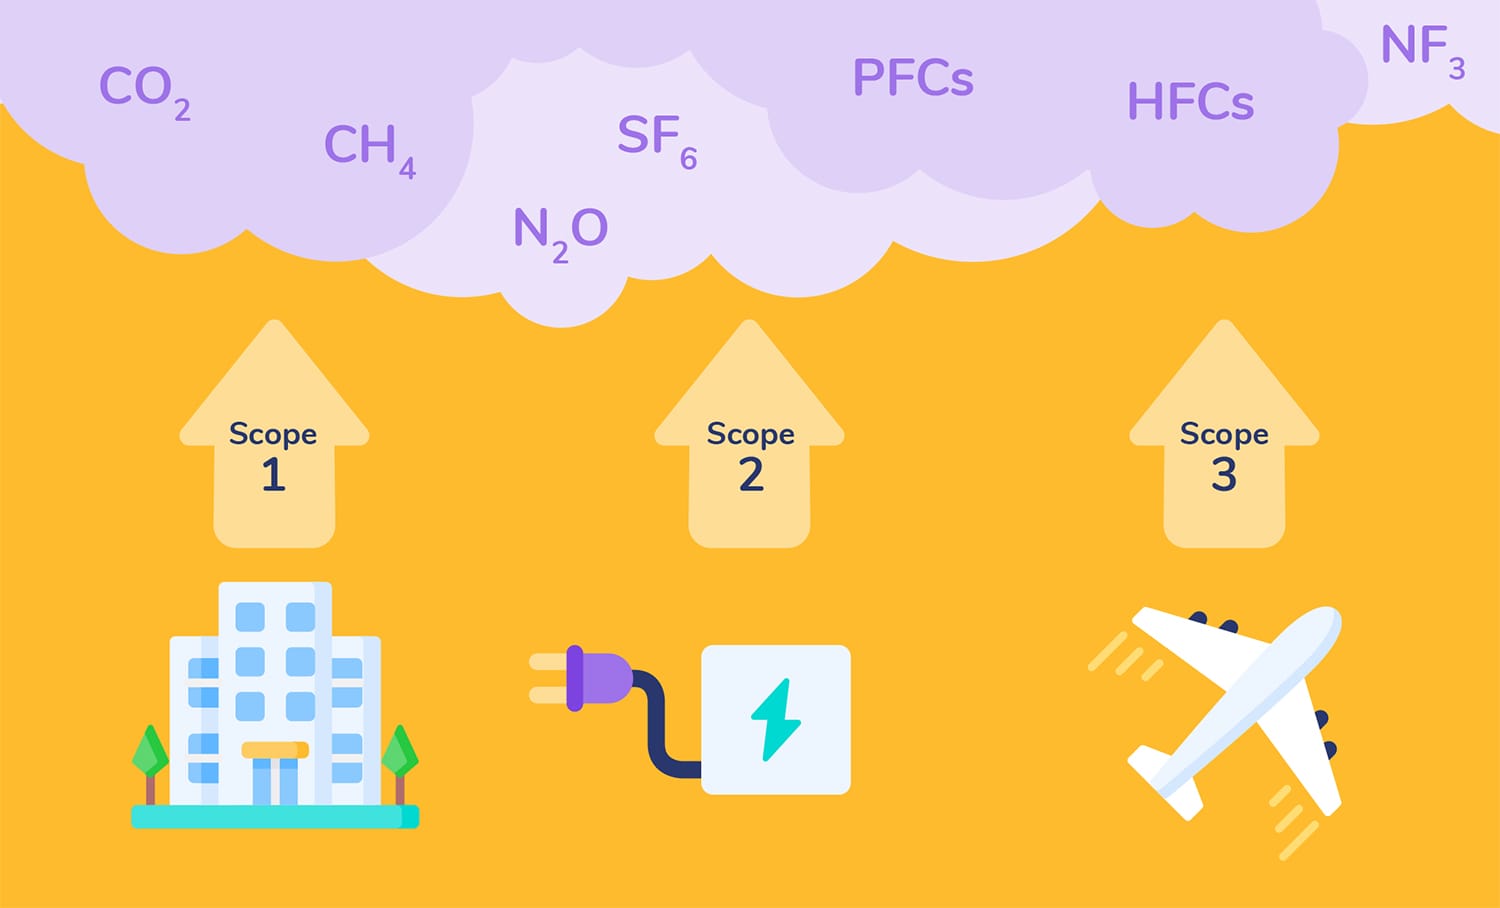
- Carbon: This is a comprehensive category that includes Scope 1 (direct emissions), Scope 2 (indirect emissions from purchased electricity, heat, or cooling), and Scope 3 (all other indirect emissions that occur in a company's supply chain, and embodied carbon). Scope 3 emissions can be particularly complex and far-reaching, covering aspects like purchased goods and services, business travel, employee commuting, construction projects, data cloud use, waste, and the use of sold products.
Beyond these core categories, organisations may also collect data on various other sustainability aspects, such as biodiversity, land use, social impact metrics (e.g. labour practices, community engagement), and the embodied carbon of materials used in their products and infrastructure.
The choice of data frequency should align with the intended use of the data and the speed at which decisions need to be made. For instance, real-time data on electricity consumption can be vital for optimising energy usage in response to grid conditions or equipment performance, while annual data may suffice for high-level sustainability reporting and tracking targets.
Common data collection frequencies include:
- Annual: This is often used for high-level reporting and benchmarking, providing an overview of performance over a year. Examples include annual energy consumption totals or yearly carbon footprint calculations (calendar or financial/academic year).
- Quarterly: This frequency allows for the tracking of performance variations due to seasonal factors, such as heating/cooling needs, and can align with financial reporting.
- Monthly: Monthly data is crucial for regular performance monitoring, identifying trends, and making operational adjustments. Many organisations aim for monthly or quarterly reviews of their sustainability metrics.
- Weekly: For certain operational aspects, weekly data can provide more granular insights into performance fluctuations and in-time corrective actions.
- Daily: Real-time or near real-time monitoring often involves daily data, allowing for immediate identification/alerts of anomalies, or areas needing attention.
- Hourly, Per Minute, Per Second: These high-frequency data streams are becoming increasingly important with the advent of smart metering and IoT devices. This level of granularity can enable sophisticated energy management strategies, such as aligning energy consumption with periods of high renewable energy availability on the grid.

Data Practices: The Good, the Bad, & the Ugly
Below, we contrast some ‘good’, ‘bad’, and ‘ugly’ real-world scenarios of sustainability data, illustrating the potential pitfalls and benefits of different data practices.
We look at:
- Ideal sustainability data characteristics and their benefits (the good)
- Common sustainability data quality issues and their negative effects (the bad)
- Counter-intuitive sustainability data scenarios and the challenges they present (the ugly)
The Good: Data That Powers Progress
In an ideal scenario, sustainability data is created at the point of contact (live) and fed back in an interpretable metric/unit to the team automatically. This vision entails real-time data acquisition and analysis, providing immediate feedback that enables proactive intervention and optimisation. Future advancements in automation and AI are expected to further facilitate this ideal state, with systems potentially taking automated actions based on real-time data insights.
Examples include:
- Data Coverage is Comprehensive: Having systems and processes for handling gaps and errors ensures a complete picture of an organisation's sustainability performance, and avoids the need for estimations or extrapolations that can introduce inaccuracies.
- Data is Substantiable: Data should be auditable and its sources clearly identified. This requires robust data validation and quality control processes to ensure the data is fit for regulatory compliance reporting.
- Data is Easily Accessible by the Right People at the Right Time: Relevant stakeholders across the organisation should have timely access to the sustainability data they need to perform their roles effectively. Siloed data can hinder collaboration and impede decision-making.
- Data Insights are Easy to Understand: The data should be presented in a clear and understandable format, avoiding jargon or overly complex metrics that can obscure meaning and hinder engagement.
The Bad: Data That Holds You Back
Bad sustainability data encompasses the various issues and shortcomings that can compromise its quality and utility, leading to flawed insights and misguided decisions. Bad data characteristics can stem from a variety of sources, including inadequate collection processes, technical limitations, conversion factor changes, human error, and organisational silos.
Examples include:
- The Great Unknowns: This refers to the dangerous category of issues that organisations are unaware of. These hidden data problems can lead to significant errors and misinterpretations without any indication that something is amiss.
- Lots of Data Gaps: Missing data points can create an incomplete picture of sustainability performance, making it difficult to establish accurate baselines, track progress effectively, and identify underlying issues. Data gaps can arise due to supplier changes, system outages, or inconsistent data collection practices.
- Data Siloed into Impenetrable Systems: When sustainability data is stored in isolated systems that are not integrated or accessible to relevant stakeholders, its value is significantly diminished. This is often the case with older building management systems (BMS) where data resides locally and cannot be easily extracted or analysed centrally.
- Access Denied: Even if data is being collected, if the individuals responsible for sustainability initiatives cannot readily access it, the organisation's ability to act on that data is severely hampered. This can be due to organisational structures, data governance policies, or a lack of awareness about who holds the relevant information.
- Data Overlaps: This occurs when the same data is counted multiple times, leading to an inflated or inaccurate representation of consumption or emissions. An example could be a summary energy bill that covers a period already included in previous individual bills, causing energy and carbon to be double-counted. Another instance could be when an organisation continues to receive invoices from a previous supplier (as well as the new supplier) after switching, potentially leading to double payments and incorrect accounting.
- Long-term Estimated Meter Readings: Relying on long-term estimations for metered data renders the information virtually meaningless. An extreme example could be a water meter reading estimated for over 3,000 days, providing no actual insight into water usage. Similarly, in organisations without actual water meters, usage may be based on pure guesstimation (e.g. pipe size diameter), offering very little tangible information.
The Ugly: Data That Misleads
Ugly sustainability data refers to situations where data collection and interpretation are inherently challenging, often due to practical limitations, counter-intuitive relationships, or the use of imperfect proxies.
Examples include:
- Using BERs as Proxy for Energy Usage: In situations where direct energy metering is absent, organisations may resort to using BERs (Building Energy Ratings) as a proxy for actual energy consumption. However, BERs are typically based on building design and theoretical calculations rather than real-world usage patterns, making them an unreliable substitute for actual consumption data. Mean electricity consumption and mean floor area by BER rating highlight the variability within rating categories, demonstrating the limitations of using BERs as a precise measure of energy use.
- Repeating Smart Meter Data: While smart meters offer the potential for high-frequency and accurate energy data, technical glitches or communication issues can sometimes result in the same data being reported repeatedly, masking actual consumption fluctuations and providing a false sense of data availability.
- Using Spend Data for Carbon Emissions from Flights: A common approach for estimating Scope 3 emissions, particularly for business travel, is to use financial spend data multiplied by emission factors. However, the price of flights can vary significantly based on factors like airline, time of booking, and class of travel, which do not directly correlate with carbon emissions. Therefore, spend data is often a crude and potentially inaccurate proxy for actual flight emissions.
- Offsets/Insets/Removal/Green/Renewable Energy Certs: The realm of carbon offsetting and renewable energy certificates is complex and fraught with potential for greenwashing or misrepresentation. Determining the true additionality and impact of these instruments can be challenging, making it difficult for organisations to definitively claim ‘green’ status based solely on these mechanisms.
- Closed Sites with Large Energy Bills: Unexpected energy bills for closed or vacant sites can be an ugly data scenario, often indicating underlying issues such as continued energy usage due to shared connections with neighbouring buildings that were not properly disconnected or supplier/admin errors.
- Counter-intuitive Data Relationships: What appears to be a positive change in one metric might have unintended negative consequences in another area. For example, introducing an energy efficiency measure, like reducing night-time electricity consumption through LED lighting upgrades, might unintentionally lead to an increase in gas consumption if the reduced waste heat from the old lighting system necessitates greater reliance on the building's heating system. This underscores the importance of considering the broader system impacts of energy-saving initiatives.
Moving Towards Good Data
Improving sustainability data management requires a focus on quality from the outset.
Key steps include:
- Scope Matters, Define it Carefully: The complexities of sustainability data management are often amplified by the breadth of scope and the evolving nature of sustainability reporting requirements. Organisations need to carefully define the boundaries of their sustainability data collection and analysis, ensuring that the chosen metrics and proxies are truly reflective of their intended purpose.
- Start Simple and Use Existing Data: Overcoming the perceived enormity of sustainability data management is crucial. The organisation should begin with what it has, learn as it goes, and incrementally build its capabilities. Organisations should begin their journey by focusing on readily available data sources, such as utility bills and procurement records.
- Prioritise Data Quality from the Outset: Invest in data quality assurance processes, including data profiling, validation rules, and regular audits (internal and/or external) to identify and rectify inaccuracies and inconsistencies. Implementing sanity checks on the data – stepping back and asking whether it makes common sense – is a simple but effective way to catch obvious errors.
- Start with a Clear Understanding of Reporting Requirements and Objectives: Identify the key stakeholders and reporting frameworks relevant to the organisation. This will help define the scope of data that needs to be collected and the level of granularity required.
- Establish Clear Data Governance Frameworks: Implementing data governance policies and procedures that define data ownership, roles and responsibilities, data quality standards, and access protocols is crucial for ensuring data integrity and usability. Regularly review the effectiveness of the organisation’s data collection, management, and analysis processes, and implement feedback loops to refine data quality and reporting accuracy.
- Foster Cross-functional Collaboration: Sustainability is not solely the responsibility of one department. Ensure that relevant stakeholders across the organisation, e.g. Sustainability/ESG, Finance, Operations, and IT, understand the importance of sustainability data sharing and alignment, and are equipped with the skills and access needed to utilise the system and processes effectively.
- Break Down Data Silos: Implement strategies and technologies to integrate sustainability data from various sources into a centralised platform. This will provide a holistic view of performance and facilitate more comprehensive analysis.
- Leverage Real-time Data and Smart Technologies: For operational efficiency and proactive management, strive to obtain and analyse data in a timely manner. Real-time or near real-time data can be particularly valuable for energy management and identifying immediate issues. Explore opportunities to automate data collection using smart meters, IoT devices, and integrated software solutions. This can reduce manual errors, improve data frequency, and free up resources for analysis and action.
- Focus on Meaningful Metrics and KPIs: Identify a core set of sustainability KPIs that are relevant to the business and aligned with its sustainability goals. Start by tracking key indicators like GHG emissions, energy intensity, and waste diversion rates.
- Develop a Phased Approach to Scope 3 Emission Measurements: Engage with suppliers to improve data transparency and understand different calculation methodologies (e.g. spend-based, activity-based, supplier-specific), then gradually work towards more accurate and granular data collection as capabilities and resources allow.

Small steps taken consistently over time can lead to significant impacts
It is really important to not lose sight of the overall objectives for sustainability – focusing more time and effort on meaningful projects and processes that deliver real-world carbon reduction outputs, and less on the managing and reporting of data.
By gaining a deep understanding of what effective sustainability data management looks like – including awareness of ‘good’, ‘bad’, and ‘ugly’ sustainability data scenarios – organisations can both future-proof their business and ensure a healthy environment for the communities in which they operate.
If you’d like the full version of this article in PDF format, you can download your free copy here.