Data Audit Page Guide
Getting your EnergyElephant data audit to 100%

The data audit tool within the EnergyElephant platform is designed to help you quickly and easily identify gaps in your energy dataset and fill them where possible.
Bills and meter data uploaded are automatically analysed by the data audit tool. The data sources at the top of the page identifies how many meter types there are in each category. These categories consist of electricity, gas, thermal fuels, water and other meters such as renewable energy sources.
Users with less than 50 meter points can access the data audit tool directly from the dashboard under the DATA dropdown. Users with over 50 meter points are recommended to have subsets (via their DIVISIONS or PERSONAL COLLECTIONS page) containing smaller numbers of data points, in the range of 2 – 50 meter points, this will make the data easier to manage and correct.
The data audit tool allows users to identify:
a) Do I have a data gap
b) Where is this data gap and what type of energy is missing
c) How do I fix this data gap
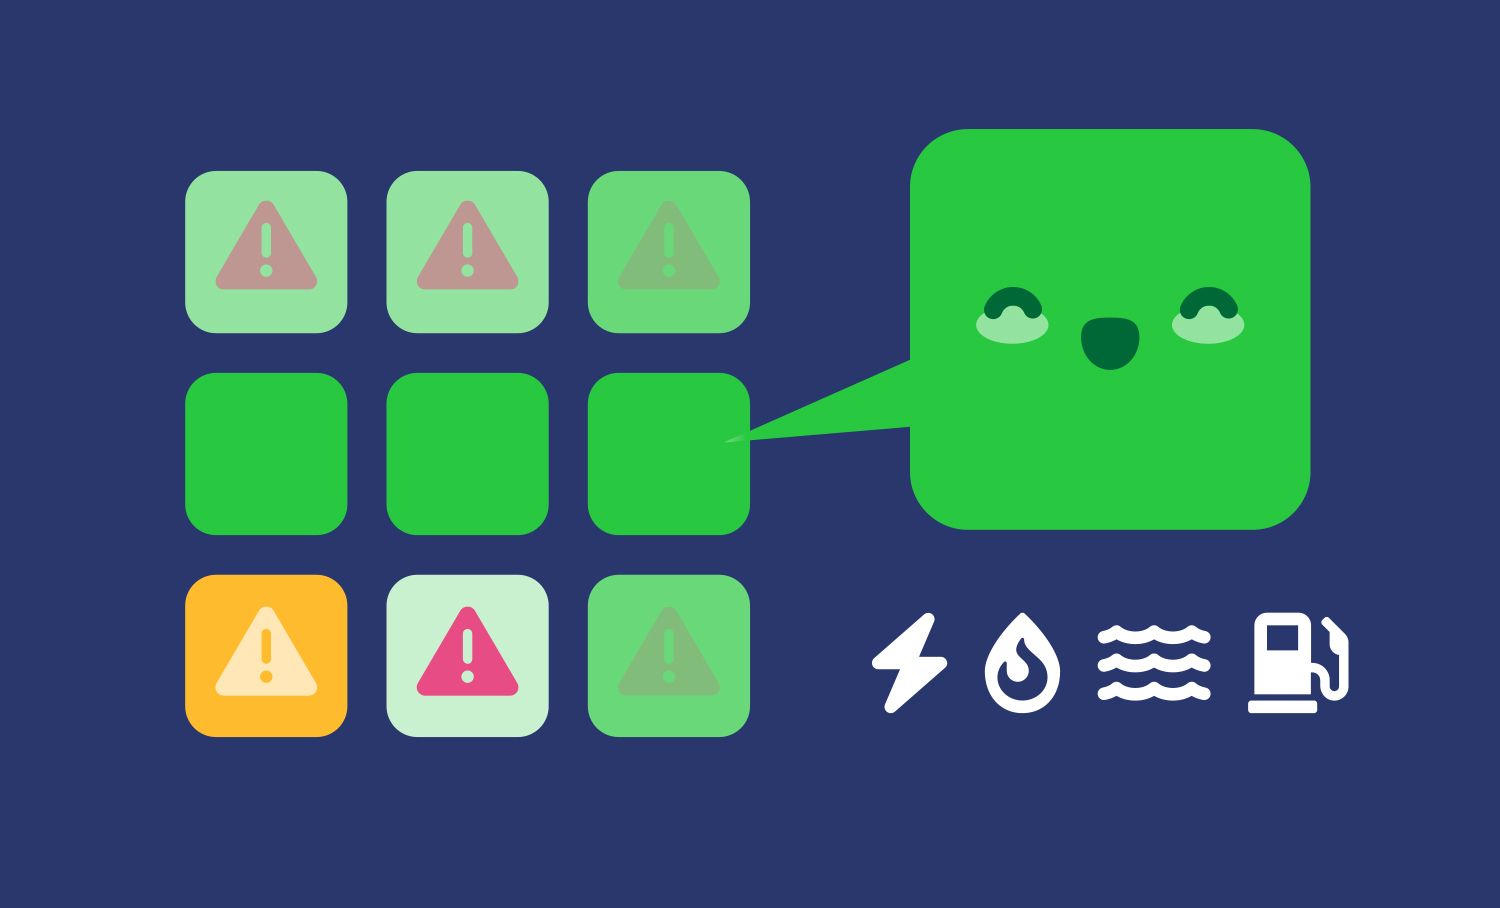
The legend shows how each colour and symbol correlates to a data anomaly. No data will show up as a light grey square. Complete data sets will show up as solid green. Data missing will show up in a varying shade of green with a warning sign. Darker shades of green indicate a more complete dataset, lighter shades indicate that a large amount of data is missing. The example below shows the varying shades of green as the dataset becomes more complete from 2019 onwards.

Orange squares with a warning sign indicate that there are overlaps in the data, this can occur when changing supplier or where data may be double counted from different upload sources. If there is an orange square in your data set, it could indicate that you need to ensure that the supplier is not billing you after switching. Some suppliers will start their billing period just before the end of your last bill which could be the cause of a small overlap.
Dark grey squares with a warning sign indicate unexpected data. This can occur when bills are still input after an end date has been set. If a building is still in use, no matter how little the use, a bill will still be received. An end date should only be set when a meter has been physically disconnected or taken over by another entity.
To set a start and end date for a meter point click on a missing data square and an information tab will pop up as shown below. This particular tab indicates that two of the 4 meter points require action – the solar meter point and the water meter point. Click on the purple label to set the earliest data point identified as the meter start date.

The meter points start date can be removed and reset at the end of the data audit page. By clicking on SHOW, the bills for that meter point can be seen. Any gaps can be identified here, missing bills can then be added to fill these gaps. It is recommended to add all bills for accuracy, however, if the bill cannot be located, the tool can automatically calculate the missing data from the previous bill and the bill after (if meter points are available). These bills can be uploaded in the upload data and bills page. There are four options to do this as shown below, uploading the original data and bills, uploading via email, automated uploads or uploading via data templates.

A complete dataset should look similar to the dataset depicted below. All missing data and gaps have been identified and mitigated to produce a full green dataset. As previously stated, the core use of the data audit tool is to help users find gaps in their datasets, identify where they are and how to fix them. This helps users to ensure all their meter points are running correctly, that they are not being double billed or receiving unexpected bills.
Complete datasets allow for more accuracy in the use of other tools across the EnergyElephant platform and better insights into meeting your targets.

Don't forget (and elephants never do), if you have any further questions, please do not hesitate to contact us for support using the Elephant support button in the bottom right when logged in!